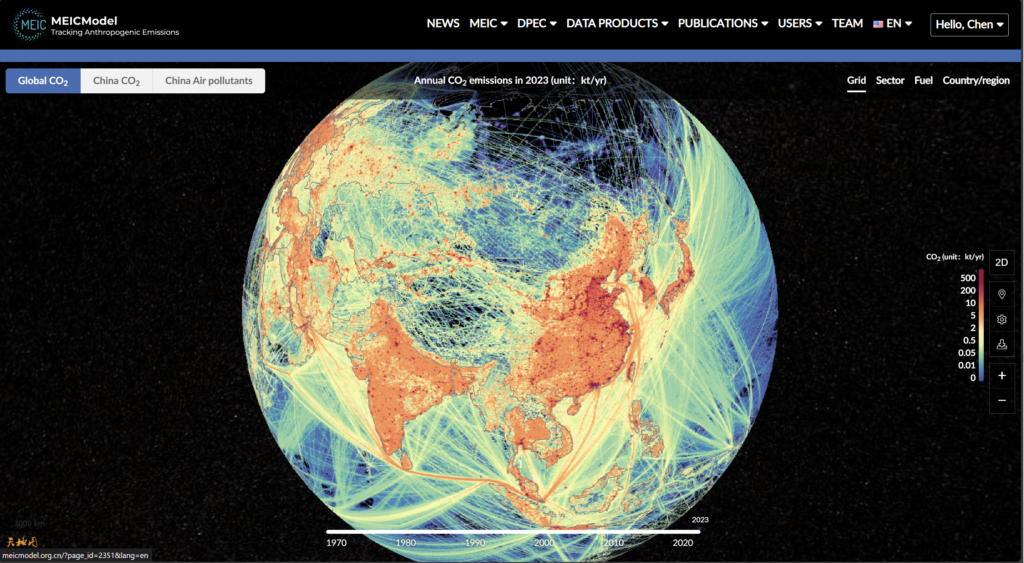
2023-12-24| MEIC team
Anthropogenic carbon emissions show significant spatiotemporal heterogeneity. Accurate representation of when and where emissions occur is crucial for climate change modeling, carbon cycle research, and formulation of emission reduction policies. Existing global carbon emission databases mostly downscale national total emissions by temporal and spatial surrogate to support the spatiotemporal distribution of emissions, which makes it difficult to reflect the complex variation characteristics of anthropogenic emissions at high spatiotemporal resolution.
To address this issue, the MEIC team at Tsinghua University cooperated with the team of China Emission Accounts and Datasets (CEADs), Chinese Academy of Environmental Planning of the Ministry of Ecology and Environment, and other research groups with support from the National Natural Science Foundation of China’s Innovative Research Group Project and the National Key R&D Program. We developed intelligent fusion and modeling techniques for multi-source data and constructed big-data driven methods for high resolution spatiotemporal dynamics characterization and integrated spatiotemporal dynamics scaling. By cross-scale fusion of global human activity data from over 130 public or commercial databases, we estimated emissions for over 100,000 industrial facilities, 2.3 billion vehicles, 800,000 shipping voyages, and 140,000 flight routes worldwide and developed a monthly 0.1° resolution dataset of anthropogenic carbon emissions since 1970. In 2023, 70% of global monthly CO2 emissions were represented based on actual monthly activity changes, and 75% were spatially distributed based on actual emission source locations, significantly enhancing the accuracy of global anthropogenic carbon emission representation at high spatiotemporal resolution.
Recently, the MEIC team released a monthly global carbon emission dataset at a 0.1° resolution for the period 1970-2023. The dataset covers emissions from fossil fuel combustion and cement production, aggregated as six sectors: Electricity and heat production, industries and construction, transport, residential and commercial, international aviation, and international navigation.
The data can be viewed and downloaded via the MEIC website (http://meicmodel.org.cn). The website provides users with a variety of interactive features, including customized data map display, figure download, and data download services. We also offer convenient services for online dynamic computing, visualization analysis, and data download (Figure 2).
Users can download the previously described data after registering and logging in the MEIC website (http://meicmodel.org.cn). Welcome to download the MEIC data and provide valuable feedbacks. The MEIC team welcomes communication and cooperation in various ways. Please contact us via meic@tsinghua.edu.cn.


