Q & A
This page will be regularly updated by the MEIC team according to the users’ questions.
About the gridded inventory >
Q1. What is the unit of each pollutant in MEIC gridded inventory?
A1: The unit of SO2, NOx, CO, NMVOC, NH3, PM10, PM2.5, BC, OC, and CO2 is “metric ton per grid”, and the unit of “VOC mechanism species” is ” million mol per grid”.
Q2. How to develop speciated VOC emissions according to multiple chemical mechanisms?
A2: The VOC emissions (unit: metric ton per grid) were speciated and lumped into the species (unit: million mol per grid) of different chemical mechanisms used in CTMs by using an explicit assignment approach and updated NMVOC source profiles. We also use the built-in unit conversion coefficient table for unit conversion. For the detailed process, please refer to the following article: https://acp.copernicus.org/articles/14/5617/2014/.
Q3. What if an error is reported in the process of generating gridded emissions?
A3: All options on the data page need to be filled, please check if there are any omissions.
Q4. How to get the spatial distribution map of the downloaded emissions data?
A4: The downloaded emissions data include three data formats (.asc, .nc, .xml), among which the .asc file can be opened directly using the ArcGIS software. The MEIC website also provides an interactive emission distribution page. For details, please refer to the data page.
Q5. Can the MEIC model provide hourly emissions data used by CTMs?
A5: The MEIC website does not provide hourly emissions data at present. If you have customized requirements related to the MEIC inventory, please contact meic@tsinghua.edu.cn.
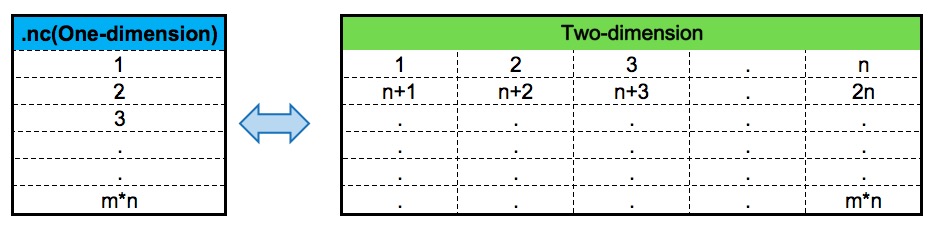
Q6. The emissions data in the Netcdf format are one-dimensional. How to map them to the two-dimensional data?
A6: Let’s assume the data of the selected area have the dimension of m*n, which covers m grids in the north-south direction and n grids in the east-west direction. The relation between the one-dimensional data and the two-dimensional map is shown in the figure below:
Q7. What is the latitudinal and longitudinal range provided in the gridded emission data?
A7: They are the boundaries of the gridded emissions map.
Other common questions >
Q8. How to cite the MEIC data?
A8: Please see How to cite.
Q9. How could I get the emission summary by year, province, and source sector?
A9: After the account application is approved, the emission summary of the ten air pollutants and carbon dioxide of five emission sectors (power, industry, residential, transportation, and agriculture) can be obtained from the download page. The unit of emissions data is “metric ton per year”.
Q10. How could I get the activity data and emission factors?
A10: Due to the large amount of data used in the MEIC model, the MEIC website currently does not provide the activity data and emission factors online. In case that you have specific data requirements, please contact the MEIC model team.
Q11. Does the MEIC model use a production-based or a consumption-based accounting approach?
A11: The MEIC inventory uses a production-based accounting approach.
If you have any other questions, please contact MEIC model team.